Where DMARC enforcement is highest by country TLD: .za leads at 51% p=reject; .cz lags at 68.7% p=none; .au is quarantine-dominant. Q1 2026 data.
The country a domain is registered in shapes how aggressively its owner enforces DMARC. In DMARCeye's Q1 2026 industry report, South African (.za) domains lead on enforcement, with 51.0% sitting at p=reject. Czech (.cz) domains are the most permissive, with 68.7% still at p=none and only 10.2% at full enforcement. Australian (.au) domains take a third path entirely: 52.6% sit at p=quarantine, the staged middle setting that almost no other top-level domain favors.
This article unpacks one view from the Q1 2026 report: DMARC policy distribution across the 11 most-monitored top-level domains. Numbers reflect outcomes across the several thousand domains DMARCeye actively monitors. The picture for the broader, unmonitored domain space is almost certainly different, and likely worse.
The 30-second version:
What's in This Guide
- What Country TLDs Tell You About DMARC
- DMARC Policy by Country TLD
- What's Driving the Regional Patterns
- What This Means for Your Setup
- The Takeaway
What Country TLDs Tell You About DMARC
A top-level domain, or TLD, is the suffix at the end of a domain name. .com, .org, and .net are generic TLDs (gTLDs) that anyone, anywhere, can register. .za, .cz, .de, and .au are country-code TLDs (ccTLDs) tied to a specific country's registry (the full list is maintained at the Public Suffix List). The TLD doesn't directly affect how DMARC works as a protocol. What it tells you is which jurisdiction's regulatory environment, which industry mix, and which set of operator habits the domain operates under.
DMARC adoption isn't uniform across countries because regulators, banks, and large platforms in each jurisdiction push at different speeds. A South African bank that has to comply with national fraud rules will publish p=reject on its production domains. A Czech small business that hasn't been pushed by anyone yet will sit at p=none indefinitely, monitoring DMARC reports but never asking receivers to act on them. The TLD doesn't cause this difference, but it's a useful proxy for the environment the domain is operating in.
DMARC Policy by Country TLD
The Q1 2026 industry report measured DMARC policy distribution across the 11 top-level domains DMARCeye monitors most heavily. Each row below shows what share of monitored domains under that TLD sits at each policy level.
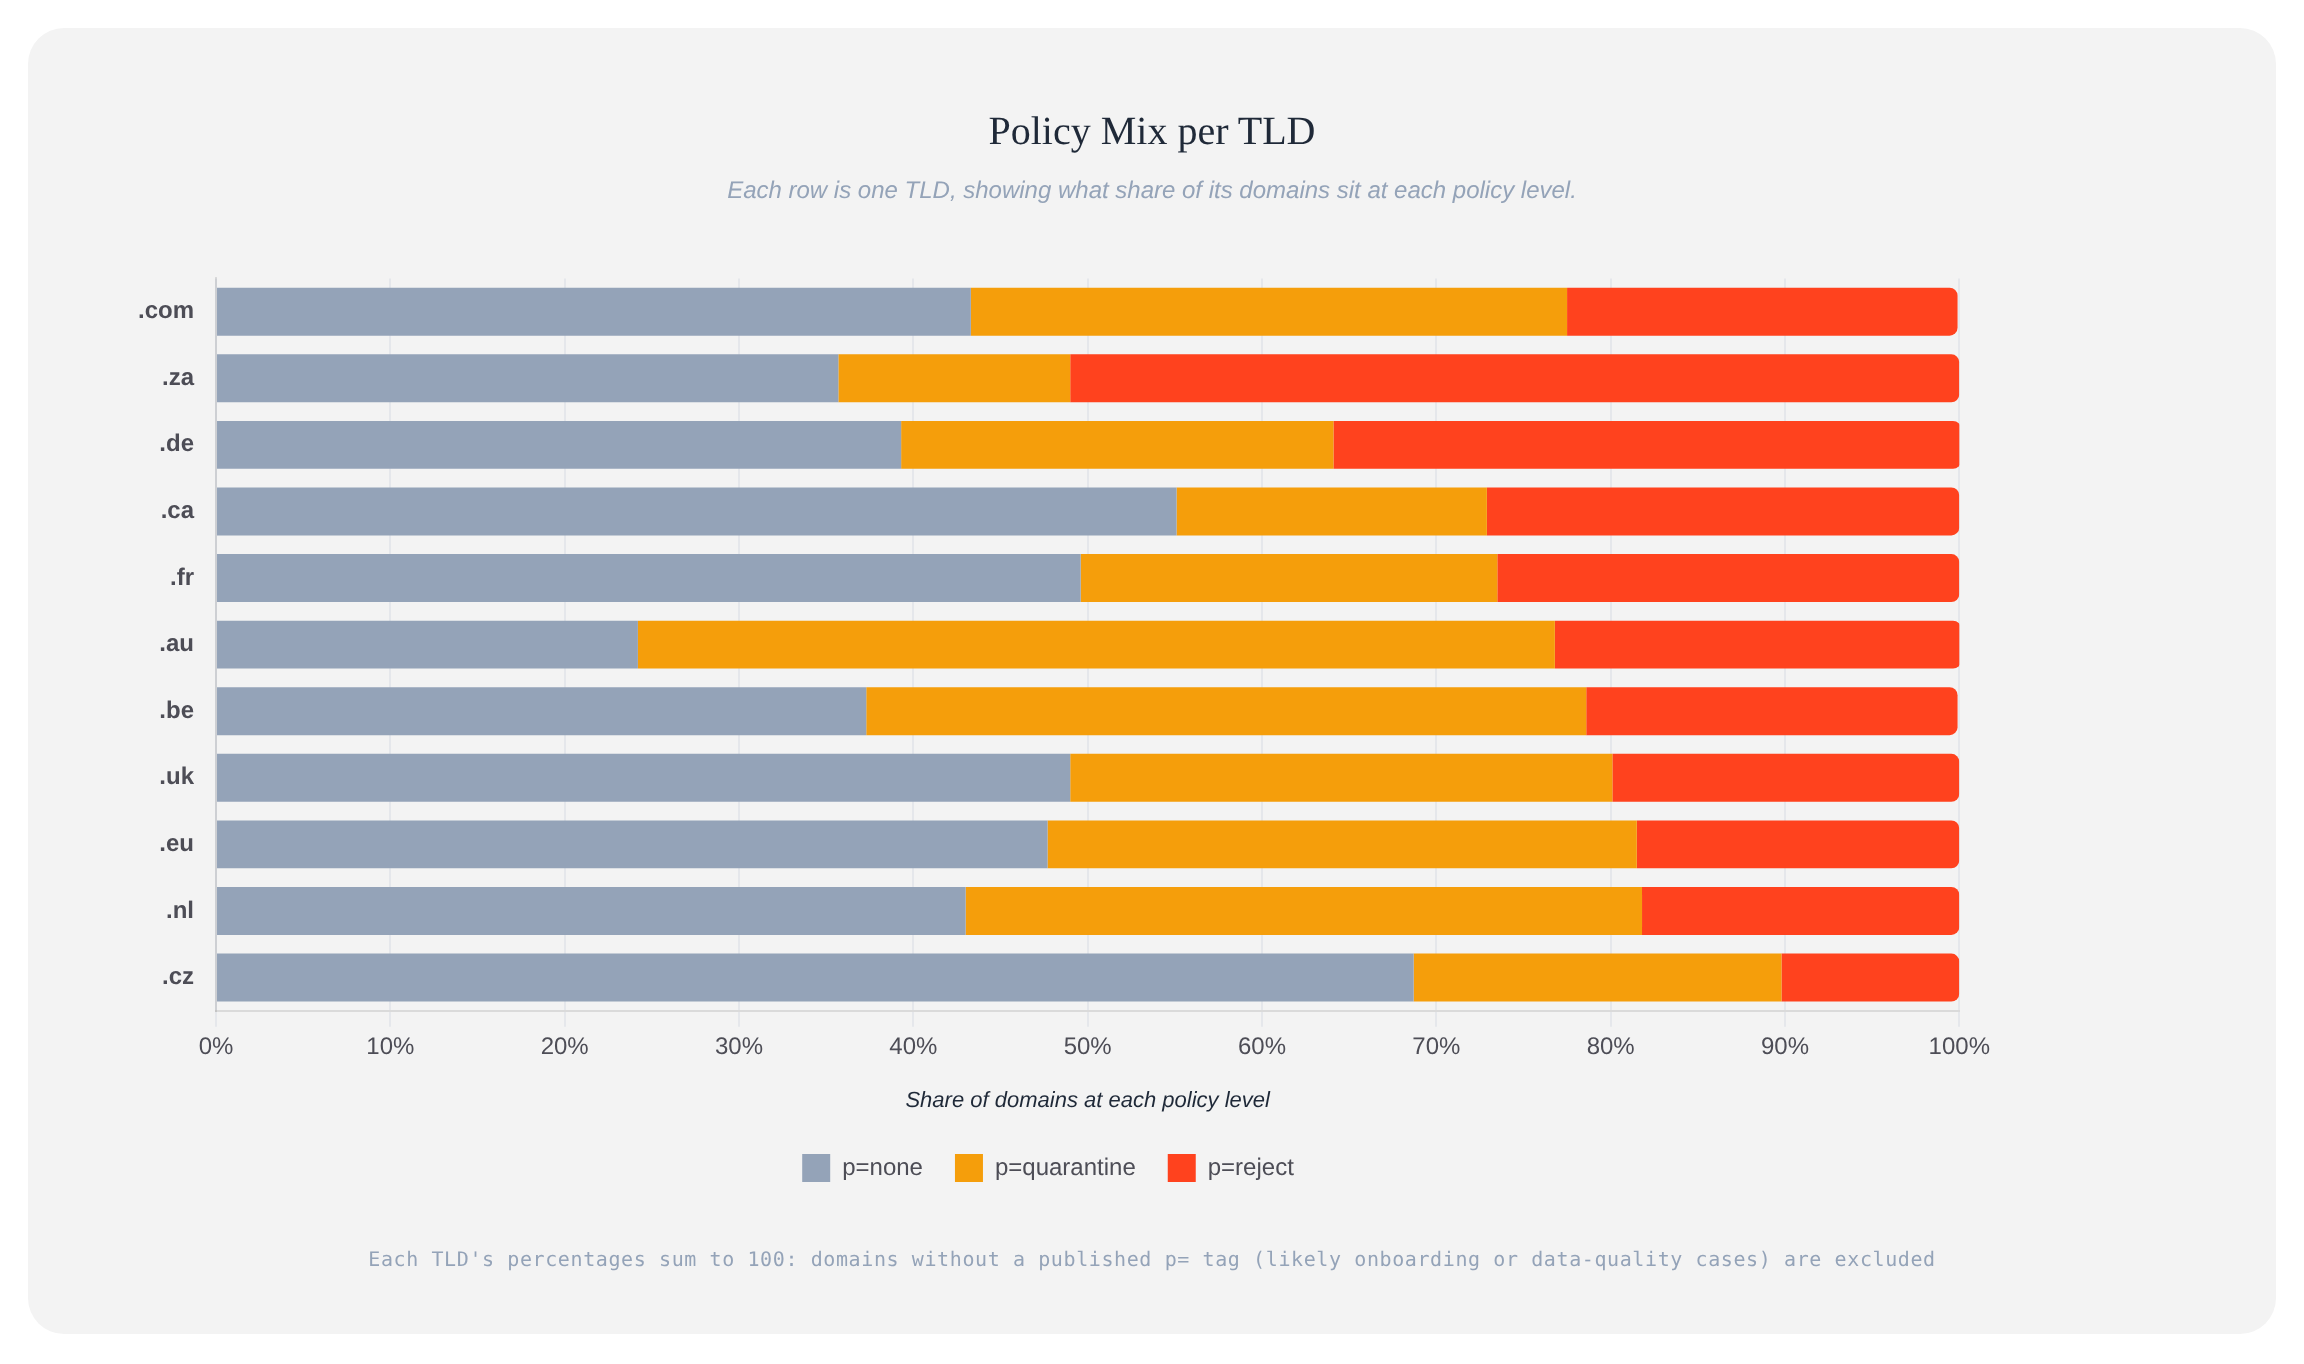
The exact per-TLD figures, for anyone who wants to compare specific markets:
| TLD | p=none |
p=quarantine |
p=reject |
|---|---|---|---|
| .com | 43.3% | 34.2% | 22.4% |
| .za | 35.7% | 13.3% | 51.0% |
| .de | 39.3% | 24.8% | 36.0% |
| .ca | 55.1% | 17.8% | 27.1% |
| .fr | 49.6% | 23.9% | 26.5% |
| .au | 24.2% | 52.6% | 23.3% |
| .be | 37.3% | 41.3% | 21.3% |
| .uk | 49.0% | 31.1% | 19.9% |
| .eu | 47.7% | 33.8% | 18.5% |
| .nl | 43.0% | 38.8% | 18.2% |
| .cz | 68.7% | 21.1% | 10.2% |
p= tag are excluded.A few patterns stand out:
- .za leads on enforcement. 51.0% of monitored .za domains sit at
p=reject, more than double the .com baseline (22.4%). South Africa is the only TLD in the chart where the majority of monitored domains have reached full enforcement. - .cz is the most permissive. 68.7% of monitored .cz domains are still at
p=none, the monitor-only setting that doesn't ask receivers to act on authentication failures. Only 10.2% are atp=reject. DMARCeye is a Czech-headquartered product, which makes this finding both familiar to the team and worth flagging publicly: the .cz space has substantial room to improve. - .au sits in the middle, deliberately. 52.6% of monitored .au domains are at
p=quarantine, the staged setting that tells receivers to treat failures as suspicious but not to drop them outright. Most TLDs route their "moved past monitor-only" share intop=reject; Australia routes it intop=quarantine. The combined enforcement share (quarantine plus reject) under .au is 75.9%, second only to .za. - .de has more enforcement than the .com baseline. German domains sit at 36.0%
p=reject, well above .com's 22.4%. The combined share of domains atp=quarantineorp=rejectunder .de is 60.8% versus .com's 56.6%. - The European TLDs cluster. .fr, .uk, .eu, .nl, and .be all sit between 18% and 27% on
p=reject, broadly in line with the .com baseline. The European DMARC story is less about country variance and more about a shared, moderate adoption curve. - .ca trails the major TLDs on enforcement. Canadian domains have the second-highest
p=nonerate at 55.1%, and only 27.1% have reachedp=reject.
What's Driving the Regional Patterns
The Q1 data shows what we observed, not why. The patterns below are hypotheses to test, not findings from the dataset.
Possible reasons (not proven in our data):
- South Africa pushed early on email authentication, driven by banking. The South African Reserve Bank's anti-phishing guidance and the country's heavy exposure to financial fraud created strong incentives for the largest .za senders to reach full enforcement. Once the banks moved, smaller .za organizations followed the lead. Whether this is the actual cause is something we'd want to test with industry-level data.
- Australia's regulatory push has been graduated rather than absolute. Australia's federal cybersecurity guidance has encouraged DMARC adoption but has not (in the same way as some other jurisdictions) leaned hard on
p=rejectspecifically. A highp=quarantineshare is consistent with operators following the staged-rollout pattern the spec describes, without taking the final step. - The Czech market hasn't had the same regulatory push. .cz domains operate in a market where DMARC has not been a high-profile compliance topic. The Czech National Cyber and Information Security Agency (NÚKIB) has not issued the kind of binding guidance on email authentication that other jurisdictions have. Without a regulatory forcing function, most operators stay at
p=noneindefinitely. This is hypothesis, not finding. - Germany's higher enforcement rate likely reflects industry mix. German organizations are well-represented in DMARCeye's dataset across banking, insurance, and industrial sectors that face strong compliance pressure (BaFin, BSI guidance). That mix tilts the .de average upward.
- The European cluster reflects shared regulatory ground. .fr, .uk, .eu, .nl, and .be operate under broadly similar pressure (NIS2, GDPR, national CERTs). The similar adoption curves are consistent with a shared baseline of compliance expectation, without any one country pushing dramatically harder than the others.
What This Means for Your Setup
The TLD view is most actionable for two reader roles.
If you run marketing across multiple country TLDs (different domains for sub-brands, regional storefronts, or affiliate networks), the chart describes your audience's deliverability environment as much as your own posture. Sending under .za into a market where 51% of monitored peer domains are at p=reject is a different environment than sending under .cz, where the corresponding share is 10.2%. Receivers in heavier-enforcement environments are more attuned to authentication signals from senders in that environment. Your domain's authentication needs to be clean accordingly, especially for transactional and order-related mail where deliverability has direct revenue consequences.
If you're in international IT running infrastructure for organizations with subsidiaries across multiple country TLDs, the chart is a planning input. A multinational organization with German, Czech, and South African operations is dealing with three different DMARC environments at once. The .de side is probably already at p=quarantine or p=reject; the .za side is likely on a defined enforcement path; the .cz side may need active sponsorship to move past p=none. Where do you have subdomain policy gaps, and how do those interact with each subsidiary's TLD-level baseline?
Either way, the policy that matters is your domain's, not the TLD average. Start by checking what DMARC record is currently published for your domain:
To see your DMARC compliance broken down by sending source over time, which is where multi-region operations usually run into trouble, you need to process DMARC reports continuously. DMARCeye's free plan covers one domain with full report parsing.
The Takeaway
DMARC adoption isn't uniform across countries. The Q1 2026 data shows nearly a 60-point spread in p=none share across the 11 most-monitored TLDs.
The TLD doesn't cause these differences directly. What it tells you is the regulatory and market environment a domain is operating under, which is one of two upstream factors that shape DMARC posture before any record is published. The other is DNS provider choice, which describes operational sophistication rather than regulatory context.
If you're running DMARC monitoring across multiple country TLDs, this is context for your own numbers rather than a benchmark. DMARCeye parses your DMARC reports and tells you, for your specific domains, what's passing, what's failing, and what to fix next, without requiring you to interpret the raw XML yourself.